Highlights:
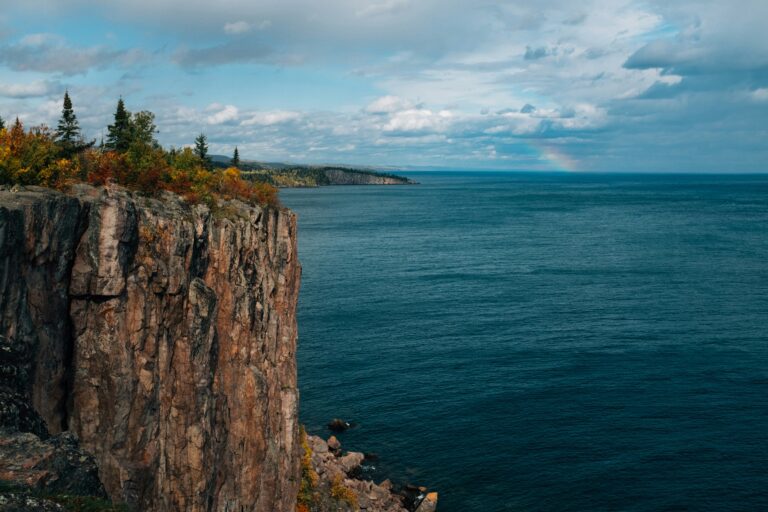
- Vermont dominates wildlife rankings with 71.83 out of 100 score, beating all competitors with its abundance of forests and crystal-clear air quality.
- New Hampshire, Maine, Massachusetts and New Jersey round out top five in Northeast clean sweep.
- Forest coverage proves crucial in rankings, with top states maintaining over 70% woodland areas.
With wildlife populations having dropped by a shocking 73% in the past 50 years, according to WWF, new data reveals the best and worst states for wildlife sustainability.
The new study by vacation rental site Lake.com examined wildlife conditions across all 50 states using 15 different measurements, including species diversity, endangered animal numbers, air and water quality levels, and land usage patterns. The 2024 data was sourced from bodies such as the US Environmental Protection Agency and the US Department of Agriculture.
Best Five States for Wildlife:
| Rank | State | Index Score | Number of species per 100 square miles | Percentage of species at risk | Number of parks (per 100,000 people) | Percentage of rural parks and wildlife land | Percentage of forest-use land |
|---|---|---|---|---|---|---|---|
| 1 | Vermont | 71.83 | 24.67 | 3% | 44.26 | 6% | 73% |
| 2 | New Hampshire | 66.93 | 25.99 | 3% | 35.91 | 8% | 73% |
| 3 | Maine | 62.26 | 7.63 | 4% | 34.23 | 2% | 85% |
| 4 | Massachusetts | 62.06 | 35.45 | 4% | 34.89 | 12% | 41% |
| 5 | New Jersey | 61.40 | 41.09 | 4% | 38.09 | 13% | 21% |
Worst Five States for Wildlife:
| Rank | State | Index Score | Number of species per 100 square miles | Percentage of species at risk | Number of parks (per 100,000 people) | Percentage of rural parks and wildlife land | Percentage of forest-use land |
|---|---|---|---|---|---|---|---|
| 1 | Texas | 29.87 | 2.40 | 10% | 24.68 | 2% | 8% |
| 2 | Oklahoma | 36.60 | 5.27 | 5% | 26.74 | 2% | 16% |
| 3 | California | 36.96 | 4.31 | 29% | 31.27 | 20% | 17% |
| 4 | Arizona | 38.25 | 4.19 | 14% | 29.63 | 10% | 18% |
| 5 | New Mexico | 40.93 | 3.78 | 10% | 32.30 | 4% | 17% |
“The states with the best wildlife populations share several key traits like large forest areas, minimal industrial pollution, and strong environmental protections,” said Stephanie Ciccarelli, CMO of Lake.com. “These natural features provide the foundation that allows diverse species to thrive.”
“States at the bottom of our rankings face major environmental problems that hurt wildlife populations,” Ciccarelli said. “Low forest coverage, poor air quality, and high levels of industrial land use make survival difficult for native species.”
The report discovered that having more species doesn’t guarantee better wildlife health. California has the most species yet suffers from one of the highest endangered rates in the country, while Vermont ranks 45th for diversity but provides much better conditions for its wildlife.
“These rankings show how environmental factors at the state level create completely different conditions for wildlife across America,” said Ciccarelli. “The data reveals that states with more forest coverage, better air quality, and fewer industrial violations typically provide better habitats where wildlife can thrive.”
The study found Hawaii facing special wildlife challenges with the highest percentage of at-risk species at 62.7%, while northeastern states generally provide better conditions for wildlife because of their extensive forest coverage and stronger environmental quality measurements.
ENDS
If you use this story, please credit and link to: https://www.lake.com
Sources:
- WWF’s Living Planet Report
- NatureServe
- U.S. Department of Agriculture
- U.S. Environmental Protection Agency
- Foursquare OS Places
Methodology:
A total of 15 factors were used to compile the index:
- Median Air Quality Index (2024, Higher = Worse) weight: 5.88%
- % of Hazardous Waste Facilities With Violations (2024) weight: 5.88%
- % of Wastewater Facilities With Significant Non-compliance (2024) weight: 5.88%
- Air Quality Index of 10% Worst Days (2024, Higher = Worse) weight: 5.88%
- % of Days With At Least Unhealthy Air Quality (2024) weight: 5.88%
- No. Parks (per 100k Population) weight: 11.76%
- Species Diversity (no. species per 100 sq. mile) weight: 14.71%
- Species Risk Levels (% at risk) weight: 14.71%
- % of Rural parks and wildlife land weight: 11.76%
- % of Defense and industrial land weight: 1.18%
- % of Farmsteads and farm roads weight: 1.18%
- % of Cropland weight: 1.18%
- % of Grassland pasture and range weight: 1.18%
- % of Forest-use land weight: 11.76%
- % of Urban areas weight: 1.18%
Once the weightings were assigned, the total score for the factors was calculated, producing an overall index score out of 100 for each entry, upon which the final ranking is based.
Full ranking with all 15 factors:
| State | Species Diversity | % Species at Risk | Parks (per 100k Population) | % of Rural Parks and Wildlife Land | % of Forest-use Land | Median Air Quality Index | % of Hazardous Waste Facilities With Violations | % of Wastewater Facilities With Significant Non-compliance | Air Quality Index of 10% Worst Days | % of Days With At Least Unhealthy Air Quality | % of Defense and Industrial Land | % of Farmsteads and Farm Roads | % of Cropland | % of Grassland Pasture and Range | % of Urban Areas |
|---|---|---|---|---|---|---|---|---|---|---|---|---|---|---|---|
| Vermont | 24.67 | 3% | 44.26 | 6% | 73% | 30.75 | 42% | 3% | 45.00 | 0% | 0% | 0% | 7% | 5% | 2% |
| New Hampshire | 25.99 | 3% | 35.91 | 8% | 73% | 38.29 | 73% | 3% | 50.14 | 0% | 0% | 0% | 2% | 2% | 8% |
| Maine | 7.63 | 4% | 34.23 | 2% | 85% | 35.36 | 60% | 2% | 49.27 | 0% | 0% | 0% | 2% | 1% | 1% |
| Massachusetts | 35.45 | 4% | 34.89 | 12% | 41% | 38.69 | 42% | 5% | 55.54 | 0% | 1% | 0% | 3% | 1% | 40% |
| New Jersey | 41.09 | 4% | 38.09 | 13% | 21% | 40.00 | 23% | 2% | 59.67 | 1% | 2% | 0% | 10% | 2% | 41% |
| Minnesota | 3.54 | 3% | 63.18 | 5% | 31% | 34.62 | 49% | 4% | 50.19 | 0% | 0% | 0% | 43% | 7% | 2% |
| Hawaii | 22.08 | 63% | 33.95 | 27% | 33% | 26.00 | 38% | 0% | 36.33 | 0% | 6% | 0% | 2% | 19% | 7% |
| Wisconsin | 5.30 | 3% | 68.78 | 2% | 48% | 39.00 | 77% | 2% | 54.41 | 0% | 0% | 1% | 28% | 8% | 4% |
| Pennsylvania | 7.01 | 4% | 40.90 | 7% | 57% | 39.63 | 26% | 7% | 58.32 | 0% | 0% | 0% | 17% | 4% | 11% |
| South Dakota | 3.17 | 2% | 47.58 | 2% | 4% | 31.50 | 3% | 2% | 49.50 | 0% | 0% | 0% | 40% | 51% | 0% |
| New York | 7.07 | 5% | 29.93 | 15% | 52% | 37.27 | 46% | 7% | 55.46 | 1% | 1% | 0% | 14% | 8% | 9% |
| Rhode Island | 200.97 | 3% | 29.76 | 2% | 44% | 37.33 | 65% | 5% | 54.33 | 0% | 0% | 0% | 3% | 1% | 40% |
| Alaska | 0.32 | 8% | 47.15 | 40% | 25% | 22.75 | 0% | 7% | 48.50 | 1% | 1% | 0% | 0% | 0% | 0% |
| Oregon | 4.31 | 11% | 47.12 | 7% | 39% | 27.52 | 45% | 0% | 53.14 | 1% | 0% | 0% | 7% | 39% | 1% |
| West Virginia | 11.95 | 5% | 26.10 | 2% | 76% | 39.85 | 15% | 14% | 56.00 | 0% | 0% | 0% | 5% | 8% | 3% |
| Idaho | 3.88 | 7% | 34.62 | 10% | 31% | 26.11 | 60% | 3% | 48.37 | 1% | 1% | 0% | 11% | 35% | 1% |
| Washington | 5.08 | 7% | 40.54 | 14% | 42% | 25.39 | 77% | 35% | 45.29 | 0% | 3% | 0% | 18% | 17% | 4% |
| Delaware | 115.14 | 3% | 27.09 | 8% | 27% | 43.00 | 77% | 6% | 59.00 | 1% | 0% | 0% | 34% | 1% | 25% |
| Connecticut | 51.57 | 3% | 33.69 | 7% | 46% | 39.63 | 88% | 3% | 59.50 | 3% | 0% | 1% | 4% | 1% | 39% |
| Montana | 2.01 | 5% | 39.39 | 7% | 20% | 24.04 | 68% | 6% | 42.50 | 0% | 0% | 0% | 16% | 54% | 0% |
| North Carolina | 8.50 | 10% | 24.73 | 5% | 58% | 39.63 | 11% | 2% | 55.11 | 0% | 1% | 0% | 15% | 5% | 11% |
| Michigan | 5.54 | 4% | 40.46 | 3% | 53% | 39.85 | 56% | 8% | 58.15 | 0% | 0% | 0% | 21% | 5% | 7% |
| Wyoming | 3.28 | 7% | 45.44 | 10% | 10% | 34.95 | 12% | 9% | 52.79 | 1% | 0% | 0% | 4% | 73% | 0% |
| Maryland | 32.43 | 4% | 31.71 | 4% | 35% | 41.31 | 26% | 14% | 61.81 | 1% | 2% | 0% | 23% | 6% | 22% |
| Virginia | 9.63 | 8% | 27.68 | 3% | 61% | 36.70 | 57% | 3% | 50.20 | 0% | 1% | 0% | 11% | 10% | 7% |
| Florida | 8.15 | 14% | 27.87 | 17% | 39% | 43.21 | 65% | 1% | 56.45 | 0% | 2% | 0% | 8% | 14% | 15% |
| Tennessee | 9.15 | 10% | 27.38 | 4% | 51% | 40.78 | 51% | 1% | 56.52 | 0% | 1% | 1% | 19% | 13% | 8% |
| Louisiana | 8.09 | 5% | 22.08 | 5% | 53% | 43.23 | 21% | 19% | 60.45 | 1% | 1% | 0% | 17% | 8% | 5% |
| Illinois | 5.87 | 5% | 52.14 | 2% | 13% | 43.52 | 26% | 5% | 60.13 | 1% | 0% | 1% | 67% | 5% | 8% |
| Kansas | 3.40 | 3% | 41.81 | 1% | 5% | 36.73 | 44% | 2% | 55.82 | 1% | 0% | 0% | 56% | 34% | 1% |
| Arkansas | 6.56 | 6% | 25.97 | 4% | 54% | 43.73 | 60% | 8% | 58.36 | 0% | 0% | 0% | 24% | 13% | 2% |
| Alabama | 8.95 | 15% | 24.91 | 1% | 71% | 39.07 | 41% | 4% | 55.73 | 0% | 1% | 0% | 9% | 9% | 5% |
| Kentucky | 8.25 | 7% | 24.37 | 2% | 47% | 41.42 | 17% | 9% | 53.96 | 0% | 1% | 1% | 26% | 15% | 4% |
| Iowa | 4.53 | 3% | 58.86 | 1% | 8% | 43.14 | 39% | 14% | 57.86 | 0% | 0% | 1% | 75% | 9% | 2% |
| Nebraska | 3.37 | 2% | 42.33 | 1% | 3% | 33.00 | 69% | 7% | 54.44 | 0% | 0% | 0% | 45% | 48% | 1% |
| Indiana | 8.65 | 5% | 36.18 | 2% | 21% | 42.33 | 66% | 2% | 59.18 | 0% | 1% | 1% | 55% | 7% | 8% |
| North Dakota | 2.74 | 2% | 51.09 | 2% | 1% | 39.56 | 53% | 5% | 62.67 | 3% | 0% | 0% | 62% | 30% | 0% |
| Mississippi | 7.63 | 7% | 17.19 | 1% | 64% | 43.00 | 49% | 6% | 57.10 | 0% | 1% | 0% | 17% | 9% | 3% |
| Missouri | 4.86 | 5% | 40.62 | 1% | 34% | 41.14 | 48% | 8% | 55.38 | 0% | 0% | 1% | 35% | 20% | 3% |
| South Carolina | 12.31 | 9% | 22.89 | 2% | 66% | 43.69 | 72% | 5% | 59.85 | 0% | 2% | 0% | 10% | 6% | 9% |
| Georgia | 7.71 | 13% | 26.88 | 2% | 65% | 43.48 | 53% | 2% | 60.79 | 1% | 2% | 0% | 12% | 4% | 10% |
| Colorado | 3.47 | 9% | 44.20 | 10% | 22% | 40.19 | 34% | 5% | 67.19 | 3% | 1% | 0% | 16% | 48% | 2% |
| Ohio | 7.71 | 4% | 40.65 | 1% | 30% | 43.22 | 26% | 22% | 63.14 | 1% | 0% | 1% | 41% | 7% | 12% |
| Nevada | 3.53 | 16% | 27.54 | 9% | 7% | 38.44 | 15% | 0% | 58.00 | 2% | 6% | 0% | 1% | 74% | 1% |
| Utah | 4.74 | 15% | 37.10 | 6% | 19% | 41.53 | 32% | 1% | 66.65 | 2% | 4% | 0% | 3% | 65% | 1% |
| New Mexico | 3.78 | 10% | 32.30 | 4% | 17% | 32.69 | 30% | 4% | 57.25 | 2% | 5% | 0% | 2% | 70% | 1% |
| Arizona | 4.19 | 14% | 29.63 | 10% | 18% | 43.69 | 29% | 0% | 72.00 | 4% | 4% | 0% | 2% | 61% | 2% |
| California | 4.31 | 29% | 31.27 | 20% | 17% | 43.73 | 35% | 1% | 69.98 | 4% | 4% | 0% | 9% | 31% | 5% |
| Oklahoma | 5.27 | 5% | 26.74 | 2% | 16% | 45.24 | 41% | 14% | 67.76 | 2% | 1% | 0% | 27% | 43% | 2% |
| Texas | 2.40 | 10% | 24.68 | 2% | 8% | 43.00 | 37% | 1% | 67.27 | 3% | 1% | 0% | 17% | 62% | 4% |