America’s Cleanest and Dirtiest Lakes: 2025 Report on Lake Pollution and Water Quality
Lake has released our 2025 report ranking the cleanest and dirtiest lakes in the United States. Discover why Lake Superior ranks #1 on the cleanest lakes list, and get acquainted with factors that influence a lake’s position on the cleanest list and the dirtiest list.
Driving The News
- Lake Okeechobee is the dirtiest lake in the US today, with visibly murky water indicated by its 34.36 NTU turbidity levels and lead contamination at 0.67 µG/L.
- Lake Superior is the nation’s cleanest, thanks to its oxygen-rich (10.45 mg/L), clear (.46 NTU turbidity) and low-minerals water (44.04 mg/L Total Dissolved Solids).
- Out of the 100 largest lakes in America, 46 had up-to-date chemical composition data.
The Cleanest and Dirtiest Lakes At a Glance
Lake Superior deserves its name all the more by virtue of its second-to-none crystal-clear water. The title for America’s dirtiest lake, on the other hand, goes to Florida’s Lake Okeechobee.
The study, conducted by vacation rental platform Lake.com, analyzed all the available chemical data from the National Water Quality Monitoring Council (NWQMC) for 100 of America’s largest lakes, sampled from January 1st, 2020, until July 15th, 2025. The researchers evaluated eight of the most commonly measured characteristics that can suggest a lake’s cleanliness level: dissolved oxygen, ammonia, lead, phosphorus, sulfate, total dissolved solids, turbidity and pH. They found 46 lakes to have at least three of these pollution factors measured within the indicated period.
Key Highlights
- Lake Okeechobee is the dirtiest lake in the US today.
- Lake Superior is the nation’s cleanest.
- Out of the 100 largest lakes in America, 46 had up-to-date chemical composition data.
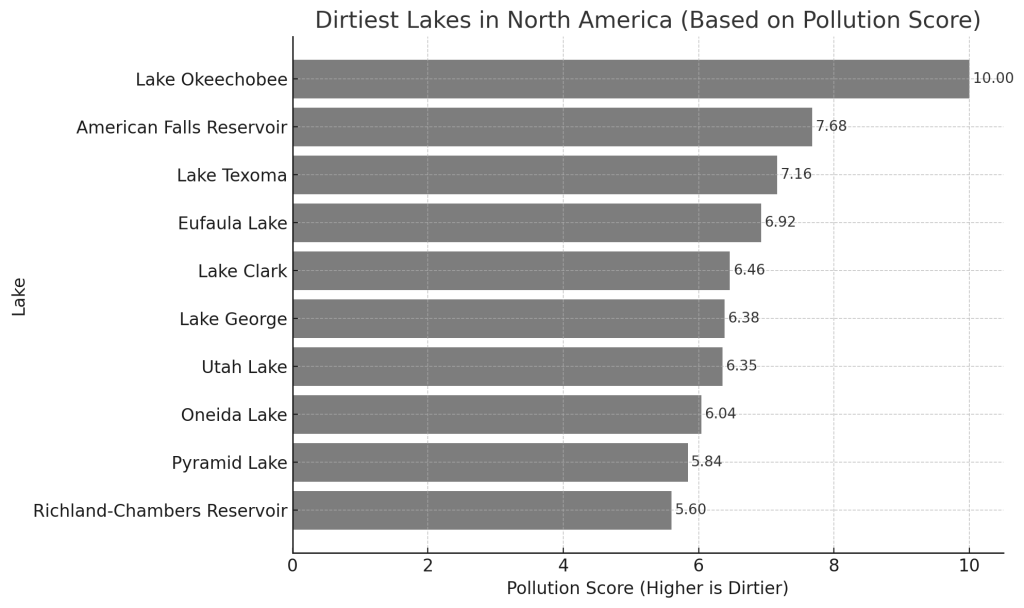
Top 10 Dirtiest Lakes in the USA Ranked
| # | Lake | State | Dissolved Oxygen (mg/L) | Ammonia (mg/L) | Lead (µg/L) | Phosphorus (mg/L) | Sulfate (mg/L) | Total Dissolved Solids (mg/L) | Turbidity (NTU) | Difference from pH7 (pH) | Pollution Score /10 |
|---|---|---|---|---|---|---|---|---|---|---|---|
| 1 | Lake Okeechobee | Florida | 6.69 | 0.04 | 0.67 | 0.18 | 24 | 239.8 | 34.36 | 0.99 | 10 |
| 2 | American Falls Reservoir | Idaho | 0.15 | 0.07 | 42.7 | 270 | 8 | 7.68 | |||
| 3 | Lake Texoma | Oklahoma – Texas | 4.42 | 0.06 | 164.05 | 753.59 | 14 | 0.9 | 7.16 | ||
| 4 | Eufaula Lake | Oklahoma | 6.41 | 0.13 | 0.08 | 29.84 | 170.94 | 34.23 | 0.64 | 6.92 | |
| 5 | Lake Clark | Alaska | 6.71 | 0.03 | 0.2 | 0.09 | 25.67 | 338 | 3.03 | 0.68 | 6.46 |
| 6 | Lake George | Florida | 7.55 | 0.01 | 0.2 | 0.06 | 56.7 | 658 | 5.57 | 1.32 | 6.38 |
| 7 | Utah Lake | Utah | 8.78 | 0.1 | 232.65 | 1,052.47 | 58.11 | 1.49 | 6.35 | ||
| 8 | Oneida Lake | New York | 4.59 | 0.13 | 0.02 | 23 | 1.78 | 6.04 | |||
| 9 | Pyramid Lake | Nevada | 6 | 5,488.44 | 2.36 | 5.84 | |||||
| 10 | Richland-Chambers Reservoir | Texas | 10.35 | 0.27 | 29.5 | 234.5 | 1.18 | 5.6 |
Dirtiest Lakes
Lake Okeechobee in Florida is America’s dirtiest lake. 0.67 µg/L of lead was detected in its most recent samples. There is no safe level of lead, and its presence in lakes is unnatural. Turbidity here was the second-highest of all evaluated lakes, measuring 34.36 NTU, after Utah Lake’s 58.11 NTU. This gives the impression of rather cloudy water. One cause for the murky appearance of Lake Okeechobee may be the high levels of phosphorus, estimated at 0.18 mg/L, which stimulates algae growth.
American Falls Reservoir in Idaho is the second dirtiest lake in the US. This 88 square miles man-made reservoir appears clear to the human eye, at first, considering its turbidity levels measure a reasonable 8 NTU. However, chemical tests concluded it contained ammonia, which should not be present at all, estimated at 0.15 mg/L. When ammonia levels reach 0.53 mg/L, the water becomes harmful to fish. This was only found in Red Lake, Minnesota, where ammonia reached 0.88 mg/L.
Lake Texoma ranked third worst for cleanliness. Bordering Texas and Oklahoma, this reservoir is quite poorly oxygenated, solids-heavy, and has a subtle rotten egg smell. Dissolved oxygen here is only 4.42 mg/L – if it were to drop below 2, Lake Texoma would become hypoxic, meaning fish would suffocate. Sulfates of 164.05 mg/L, which are the fourth worst of all studied lakes, give the water an unpleasant odor. Lake Texoma has the fifth-highest levels of Total Dissolved Solids (TDS), estimated at 753.59 mg/L. TDS refers to the totality of minerals within water, such as sulfates, chlorides, calcium, magnesium, potassium, bicarbonates, and sodium, and indicates the general quality of water.
The absolute worst levels of TDS are recorded at Pyramid Lake in Nevada, where they reach 5,488 mg/L. This is also where the pH deviates the most from the ideal level of 7 for lakes, with the last reading taken on February 12, 2020, showing an average pH level of 9.36.
Lake of the Woods, stretching across Canada’s Manitoba and Ontario provinces and into Minnesota, is the most lead-contaminated lake of the 100 included in the study. A sample taken on August 16, 2022, detected lead levels of 1 µg/L. Devils Lake in North Dakota is the smelliest of all, where sulfate concentrations reach 745.17 mg/L. This may have happened due to its glacial deposits building up over thousands of years, with no natural outlet to dilute these sulfates over time.
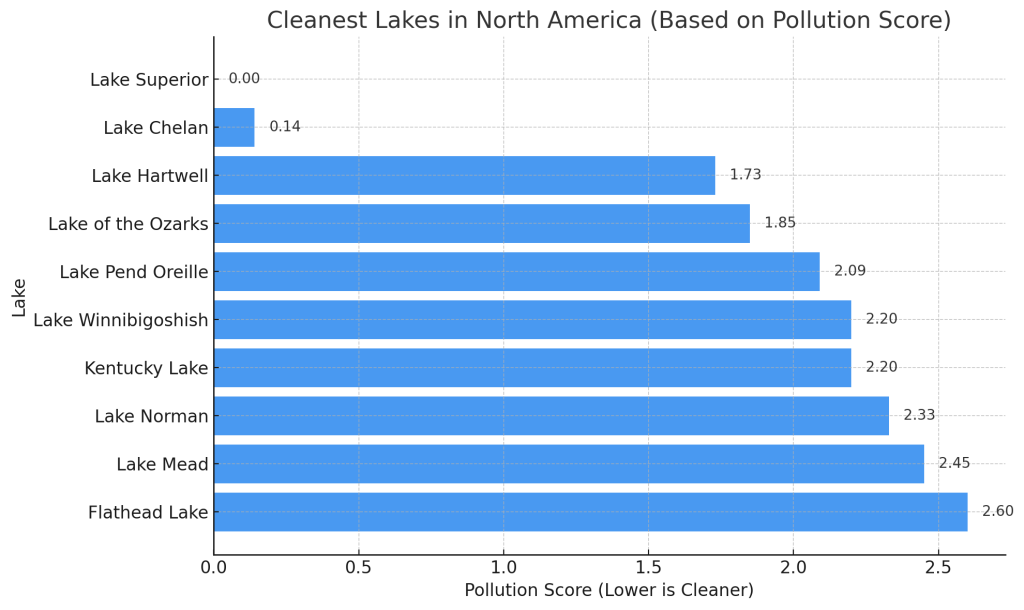
Top 10 Cleanest Lakes in the USA Ranked
| # | Lake | State | Dissolved Oxygen (mg/L) | Ammonia (mg/L) | Lead (µg/L) | Phosphorus (mg/L) | Sulfate (mg/L) | Total Dissolved Solids (mg/L) | Turbidity (NTU) | Difference from pH7 (pH) | Pollution Score /10 |
|---|---|---|---|---|---|---|---|---|---|---|---|
| 1 | Lake Superior | Michigan – Minnesota – Wisconsin – Ontario | 10.45 | 0.01 | 0.01 | 3.65 | 44.04 | 0.46 | 0.81 | 0 | |
| 2 | Lake Chelan | Washington | 9.44 | 3.6 | 30.2 | 2 | 0.01 | 0.14 | |||
| 3 | Lake Hartwell | Georgia – South Carolina | 8.55 | 1.9 | 0.51 | 1.73 | |||||
| 4 | Lake of the Ozarks | Missouri | 7.5 | 0.01 | 1.66 | 2.3 | 0.5 | 1.85 | |||
| 5 | Lake Pend Oreille | Idaho | 0.02 | 0.01 | 5.41 | 2.09 | |||||
| 6 | Lake Winnibigoshish | Minnesota | 9.38 | 0.02 | 1.3 | 1.21 | 2.2 | ||||
| 7 | Kentucky Lake | Kentucky – Tennessee | 6.21 | 84 | 3.63 | 0.36 | 2.2 | ||||
| 8 | Lake Norman | North Carolina | 7.14 | 0.03 | 2.34 | 0.23 | 2.33 | ||||
| 9 | Lake Mead | Arizona – Nevada | 4.93 | 0.03 | 3.44 | 0.05 | 2.45 | ||||
| 10 | Flathead Lake | Montana | 9.68 | 136.33 | 1.32 | 2.6 |
Cleanest Lakes
On the other hand, Lake Superior is the cleanest lake in America. It has the second-lowest levels turbidity (0.46 NTU), after Lake Michigan (0.37 NTU), and TDS, measuring 44.04 mg/L, just behind Lake Chelan (30.20 mg/L) – another worthy contender for the title of America’s cleanest lakes, ranked second overall. Lake Superior is also very rich in oxygen (10.45 mg/L), with nearly undetectable algae-friendly phosphorus levels.
On average, America’s largest lakes have an acceptable pH balance of 7.96, good turbidity levels of 9.54 NTU, and healthy dissolved oxygen of 7.29 mg/L. They do, however, have quite significant TDS of 504.05 mg/L, a ninth of which (57.15 mg/L) comprise sulfates. Phosphorus levels average 0.05 mg/L. Ammonia was spotted in 24 lakes averaging 0.096 mg/L and lead – in 11, averaging 0.367 mg/L.
“Compared to a similar study we carried out last year, comprising a different sample size, larger lakes seem to have three times less sulfates and nearly four times less TDS,” said David Ciccarelli, CEO of Lake.com. “However, ammonia concentrations were five times higher in the lakes it was measured, while lead contamination was slightly lower.
“Overall, America’s largest lakes this year are technically a little murkier compared to our measurements from 276 lakes last year, but this would not be visible to the human eye.
“We are pleased to find that, generally speaking, large lakes remain very clean and safe to swim in, though monitoring any signage near swimming spots and adhering to the indicated advice may save you from catching a rare but nasty stomach bug.”
This study was conducted by Lake.com, a vacation rental platform offering lake houses, cabins and cottages for rent.
Notes for Editors
Sources: Lake.com via the National Water Quality Monitoring Council.
Credit with link: If you use this story, please ensure to include a linked mention of Lake.com.
Methodology
This study uses data from waterqualitydata.us to rank the 100 largest US lakes by surface area based on how dirty they are.
Each lake was ranked using a score calculated with the following equally-weighed factors:
• Dissolved Oxygen Concentration;
• Ammonia Concentration;
• Lead Concentration;
• Phosphorus Concentration;
• Sulfate Concentration;
• Total Dissolved Solids;
• Turbidity;
• Difference from pH of 7.
The researchers used the latest available figures for each indicator, reported up until July 15th, 2025.
Lakes with less than three factors available in the official data were excluded, resulting in a list of 46 of the largest lakes in the US whose cleanliness could be accurately measured.
The lakes were ranked based on a total pollution score, whereby the higher the pollution score – the dirtier the lake was considered.
Visualization of Cleanest Lake Data
Visualization of Dirtiest Lake Data
Contact Details
Should you require any further information, please do not hesitate to contact Ruxanda Josan at [email protected].